⇐ Back to Part 1
Employment
Work in Waters Upton: who was engaged in it, what types of employment were there, and – in the case of jobs ‘in service’ – who provided that work, in 1841? These are questions I set out to answer by analysing data from the census.
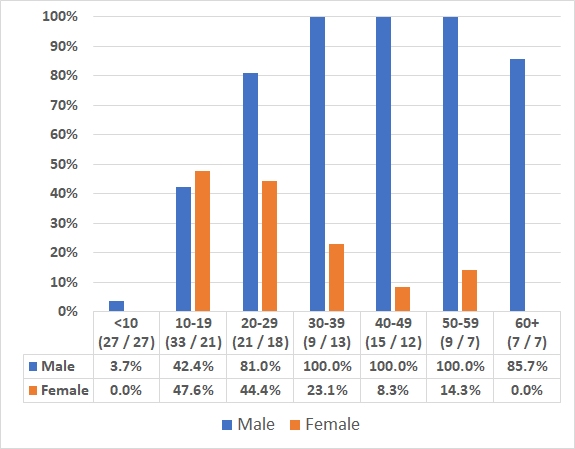
Employment rates for those enumerated on the 1841 census at Waters Upton, broken down by age and sex.
It is readily apparent from the chart above that gender and age were major factors determining whether or not you were in employment – as recorded by the census – in early Victorian Waters Upton. You were highly unlikely to be working if aged under 10 whatever your gender – unless you were a 9-year-old boy named Levi Woolley, in which case you were employed as a servant by farmer Charles Allen.
In the age group 10-19, between 40 and 50% of both males and females were in work, with a slightly higher proportion of females (though this difference may not be statistically significant). From age 20 upwards there were sharp differences between the sexes in their rates of employment. 81% of men (17 out of 21) aged 20-29 and 100% of men aged 30+ were earning a crust in one way or another, with one Thomas Shuker (aged between 70 and 74, and of independent means) being the sole exception.
For women, rates of employment (employment in fields deemed worthy of inclusion on the census at any rate) began to fall once the age of 20 was reached. Not by much at first – from 47.6% (10 out of 21) in the age group 10-19, to 44.4% (8 out of 18) in the 20-29 range – but then down to 23.1% (3 out of 13) at 30-39 and less than 20% from 40 to 59. None of the 7 women aged 60 or more who were enumerated at Waters Upton in 1841 (2 of whom were, like Mr Shuker, of independent means) were employed.
Marriage and motherhood no doubt played a large part in the different rate of adult employment for women compared with men. You can bet your life however that many of those apparently unemployed women were working very hard indeed, and not just bringing up the children and carrying out ‘domestic duties’ or ‘household work’. With regard to the wives of farmers, for example, Joseph Plymley in his General View of the Agriculture of Shropshire (published 1813) quoted a Mr Price as saying:
[In] the farm-houses, there seems to be a greater exertion of industry than I have remarked in most other counties. Besides brewing, baking, providing for the family, where workmen are maintained in the house, and managing the dairy, the farmer’s wife, with the assistance of her maid-servants, in the evenings, at spare hours, carries on a little manufacture, and gets up a piece of linen cloth for sale, every year. [Page 123]
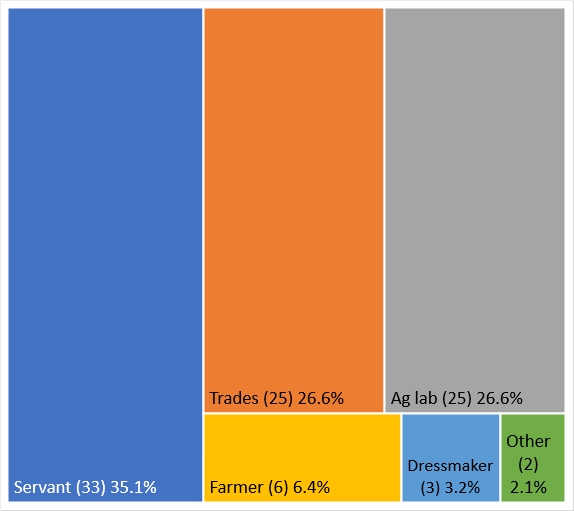
Types of employment in which those enumerated on the 1841 census at Waters Upton were engaged. The area of the chart taken up by each type equates to the percentage of those 94 people in employment who were engaged in them. With numbers and percentages shown for each type.
This chart provides a broad overview of the types of work in which the working population of Waters Upton (41.6% of the total) was engaged in 1841. Just over a third of all of those in work were servants, a type of employment I will explore in more detail shortly.
The next most ‘popular’ fields of employment were, each giving work to slightly more than a quarter of the working population, were the humble and ubiquitous agricultural labourer, and what I have called ‘trades’. Both of these areas of work were male-dominated, to the almost total exclusion of women – the only women working in either of them being Ann Morris, who like her husband William was recorded as an ‘Ag Lab’.
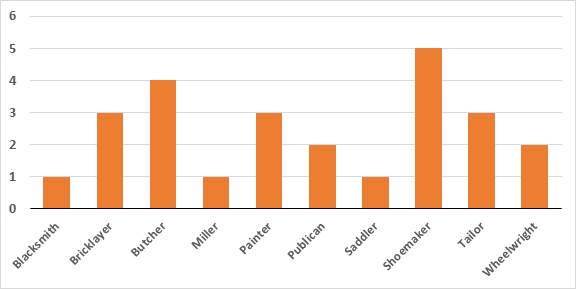
A breakdown of the numbers engaged in the various occupations included in ‘trades’.
The trades, as I have termed them, included a variety of different occupations. The majority of these were skilled or semi-skilled and would earn their practitioners a place in the lists of trades people in the county directories which became increasingly popular during the Victorian era. Clustering these occupations together in this way certainly makes for a much less cluttered employment types chart!
6 men in Waters Upton were described as farmers on the 1841 census, a ‘field’ of employment (pun intended) very much limited by the small size of the parish. The remaining workers were 3 dressmakers (all female, ages given as 15, 20 and 35), a schoolmistress (the widowed Harriet Woolley), and the parish clergyman William Corfield (who could in fact be considered as a farmer, as his position brought with it some 35 acres of farmland for his use).
Servants
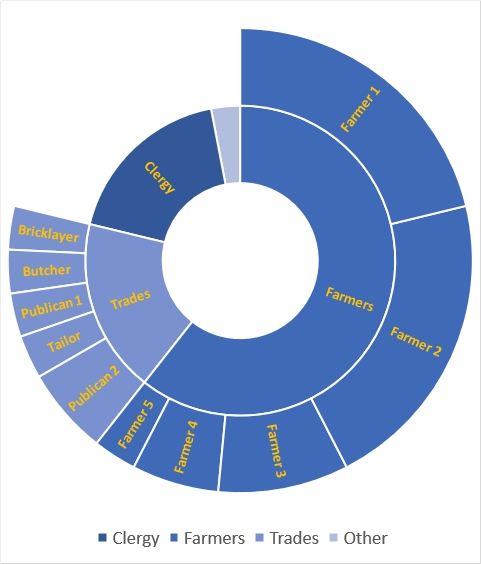
Employers of the servants enumerated on the 1841 census of Waters Upton. Each of the smallest segments on the outer ring represents one servant employed by an employer, with the larger segments in proportion.
I said I would return to the servants, and here we see who employed them. The majority worked for the parish’s farmers, those identified as farmers 1 through to 5 being: John Dickin (7 servants), Thomas Whitfield (also 7), Thomas Matthews (3), Charles Allen (2, including the above-mentioned Levi Woolley), and John Brown (1 servant) respectively. Honorary farmer William Corfield, the Rector, employed 6 servants, who were probably divided between domestic and farming services. A further 6 servants were in the employ of 5 of the parishioners who were engaged in trades, including both publicans. Finally, in the inevitable ‘Other’ category, man of (independent) means Thomas Shuker employed 14-year-old Staffordshire-born Mary Pritchard to assist in the household he occupied with his wife Charlotte.
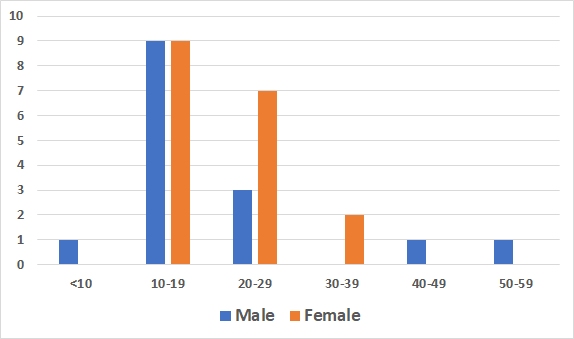
Numbers of servants on the 1841 census at Waters Upton, broken down by age and sex.
Finally in this section, a closer look at servants which provides information of some relevance to the employment rates (for females in particular) in the age groups of 10-19 and 20-29, and also to migration in those age groups.
All but 5 of Waters Upton’s servants in 1841 fell into the 20 year age range of 10-29. Of the 10 females aged 10-19 who were employed – none of whom were born in the parish – 9 were servants, and all but 1 of the 8 women in the 20-29 age group – only 1 of whom was born in the parish – were also servants.
The situation for males was rather different, with 9 out of 14 working 10-19-year-olds employed as servants (5 of the 14, of whom 2 were servants, were born in the parish), and only 3 of 17 working 20-29-year-olds (6 of the 17, only 1 of whom was a servant, were born in the parish).
All of which leads us quite neatly on to…
1841 to ’51 – who were the ‘remainers’?
(Maybe I should have given this section a more scientific-sounding title like ‘Residential fidelity’?)
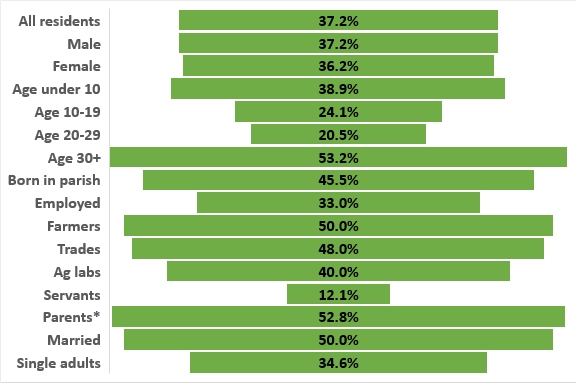
Percentages of various categories of people enumerated on the 1841 census at Waters Upton, who were also enumerated in the parish on the 1851 census. ‘Parents’ I defined as those who, whether married or single, had children aged under 20 at home with them.
As my 1841 census abstract includes links to the 1851 abstract for those who were also present at Waters Upton on the latter census, it was an easy task for me to identify the ‘remainers’ (or in some cases perhaps, to borrow an expression from family historian John Titford ⇗, the ‘bounce-backers’) and add that information to my 1841 census spreadsheet. And then to analyse the data to see if there were any factors which made people enumerated in 1841 more or less likely than on average to remain, or return…
As you can see, the average percentage of all residents of 1841 who were also present in 1851 was 37.2%. Of the 15 categories of people from 1841 which I looked at, there were several for which there was no significant difference from that overall rate of ‘remaining’. These were: sex (male or female), age under 10 in 1841 (only a slightly higher likelihood of remaining), working as an agricultural labourer in 1841 (just slightly more likely to remain), employed (regardless of employment type) in 1841 and single adult in 1841 (both of the latter giving a slightly lower likelihood of remaining).
Natives of Waters Upton who were present in the parish in 1841 were rather more likely to remain (6% more than the average), while those who were married, or parents, were significantly more likely to enumerated there again in 1851 (many people in the former group would also have fallen into the latter). The ‘remain rate’ for these categories (50% and 52.8%) was very similar to that for the 30+ age group (see next) – a category with which there was likely to have been a fair degree of overlap.
Those aged 30+ in 1841 were significantly more likely to stay (53.2% in this category remained), perhaps because many of them had by that age established strong ‘roots’ – such as ties of kinship and/or security of employment – in the community. I have not divided this category further in the chart above because I found very little difference between the various 10-year age groups within it.
Those aged from 10 to 29 in 1841 on the other hand were significantly less likely to remain, with 20-29-year-olds showing even less attachment than the 10-19-year-olds. People in both of these groups were, I suspect, more likely to leave to take up work elsewhere and, particularly in the 20-29 age group, to join marriage partners and raise a family in a location which could accommodate them.
Regarding work, we have already seen that being employed in itself made a person less (but not significantly less) likely to remain, while being an ‘ag lab’ only very slightly raised a person’s chances of staying. Employment in certain other categories did however make a significant difference, with those engaged in trades much more likely to remain. The same goes for farmers, although with only 6 of them in the parish that conclusion can only be accepted with caution (if just one more had left, their remain-rate would have dropped to 33.3%).
Of all the categories I have examined, servants were the least likely to stay in the parish – just 12.1% of those enumerated in 1841 were still in Waters Upton (as servants or otherwise) ten years later!
