The census is not just for genealogy and family history, it’s for local history too – including the specialised form of local history known as one-place studies. In the UK, a decennial national census began in 1801. The information recorded was rather limited in the first few decades (that is, up to 1831). Furthermore, with relatively few exceptions, the enumerators’ schedules from those censuses have not survived and we are left with collated summaries of the data collected.
The census of 1841 was the first which aimed to record every person, by name, in every household (along with their age, sex, occupation and – to a limited extent – their place of birth). It is also the earliest census for which the enumerators’ schedules have been retained. The information it recorded – as you will see in my 1841 census abstract – was not as detailed as in the censuses which followed, but genealogical research can add much of what was missed. Having carried out that research, and having analysed it with the aid of a trusty Excel spreadsheet, I now present what I have learned about the community of Waters Upton at the first census of the Victorian era.
Population
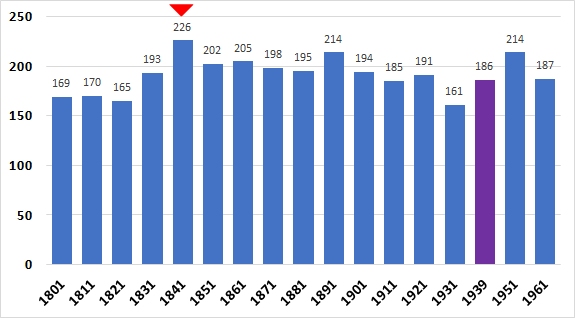
The population of Waters Upton parish as recorded in the national census of England and Wales at 10-yearly intervals from 1801 to 1961 (with the 1939 National Identity Register filling in for the cancelled census of 1941). Based on official figures taken from A Vision of Britain Through Time ⇗, with the exception of those for 1841 (adjusted by me, see below), 1861 and 1871 (my own figures as they are not given by the aforementioned source), and 1939 (derived by me from the National Identity Register).
As you can see, the population of Waters Upton in 1841 (even though I have lowered it by 2 from the official figure of 228) is the highest recorded in the 160 year period from 1801 to 1961. Hopefully when I analyse later censuses, this will shed some light on why that was – a random ‘baby boom’ in the 1830s?
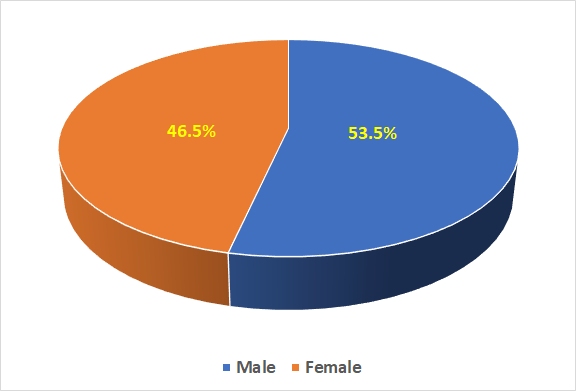
The proportion of males and females in Waters Upton in 1841. Of the 226 people enumerated in Waters Upton in 1841, 121 (53.5%) were male and 105 (46.5%) were female.
The bias towards males shown here is in contrast to the national figures: females have predominated in all census years (in 1841 the census of England and Wales showed a national split of 48.85% males and 51.15% females). Was this contrast the result of Waters Upton being a rural parish, with greater employment opportunities for men? Or was it perhaps an artefact resulting from a random fluctuation in a very small population unit? Perhaps it was a little of both. In Shropshire as a whole the male/female split in 1841 was almost equal (49.9% males / 50.1% females), while in Ercall Magna (Waters Upton’s larger, but still rural, neighbour) it was 50.9%/49.1% and in Shrewsbury St Chad (predominantly urban) it was 45.2%/54.8%. (Percentages based on figures from A Vision of Britain Through Time – Male and Female totals for England and Wales, Shropshire, Ercall Magna, Shrewsbury St Chad ⇗).
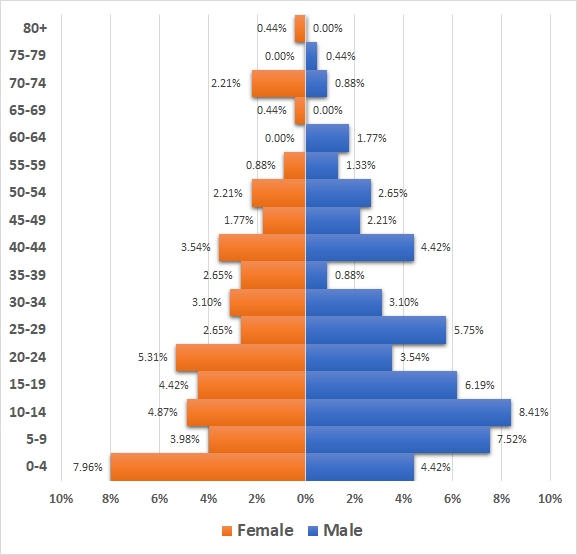
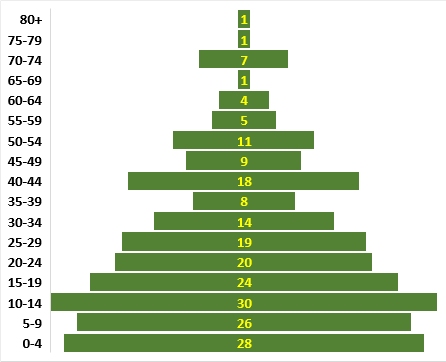
A population pyramid (or age-sex pyramid) diagram showing the population of Waters Upton in 1841 split by age and sex. Yes, I know it’s usual to display the males on the left!
Dividing a population of just 226 people into a chart with 34 categories (17 age groups split into male and female) has made a rather ragged Christmas tree instead of a pyramid! But as a friend and former work colleague of mine would say, it is what it is. Reducing the number of categories should smooth things out a little, so here is a funnel chart displaying the age categories alone (with a dark green colour to ensure the Christmas tree effect is not entirely lost):
Apart from some obvious fluctuations from the broad trend, the chart has a wide base and narrow top. This is indicative of a population with high birth and death rates (according to The Data Visualisation Catalogue ⇗), which was probably the case at the beginning of the Victorian era generally and not just in Waters Upton.
Of course, population size and structure in any given area is affected not just by birth and death rates, but also by rates of immigration and emigration. These factors – especially emigration – would certainly have been at play in Waters Upton, a small, rural parish with very limited scope to support an increased population.
Immigration
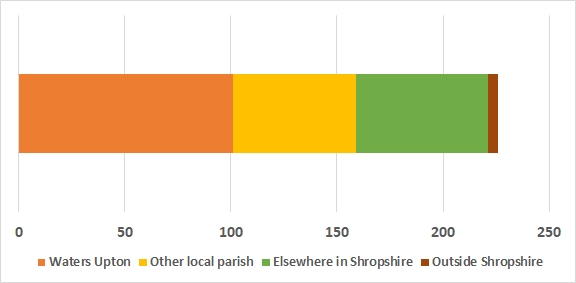
The geographic origins of the people enumerated on the 1841 census at Waters Upton. This not an analysis which can be performed by reference to that year’s census alone, as it only recorded whether or not people were born in the county in which they were then living (or, if born outside of England and Wales: Scotland, Ireland, or ‘Foreign Parts’). However through genealogical research I have established with reasonable certainty the birthplaces (to at least parish level) of 179 of the 226 people enumerated at Waters Upton. Identification of those born in the parish, by reference to baptism records, was relatively easy but some may have been missed. ‘Other local parishes’ are those within a radius of about 7 miles (or thereabouts) from Waters Upton: Hodnet, Stoke on Tern, Great Bolas, Childs Ercall, Hinstock, Chetwynd, Edgmond, Longford, Lilleshall, Kinnersley, Preston, Eyton, Wombridge, Wellington, Wrockwardine, Longden on Tern, Withington, Rodington, Ercall Magna, Shawbury and Stanton on Hine Heath. It is likely that a fair proportion of those whose births I have assigned to ‘elsewhere in Shropshire’ were in fact born in one of the ‘other local parishes’ just listed.
As you can see, in 1841 close to half of the people enumerated in Waters Upton were born in the parish. This does not necessarily mean that they had lived all their lives in the parish up to that point, but I suspect many (especially the younger ones) would have done. The rest came almost exclusively from elsewhere in Shropshire, with about half of them (in reality, probably at least two thirds) from the local parishes listed above. This indicates both immigration to and emigration from the parish, with incomers originating from the local area or further afield within Shropshire. Just 5 people were born outside of the county: 1 from neighbouring Staffordshire, 3 from Suffolk (there’s a story there!), and 1 from an extra-Salopian county which I have not been able to pin down.
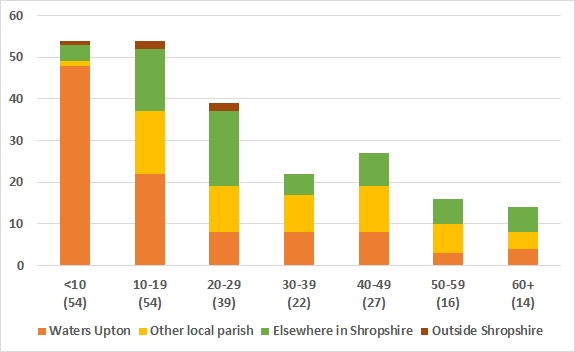
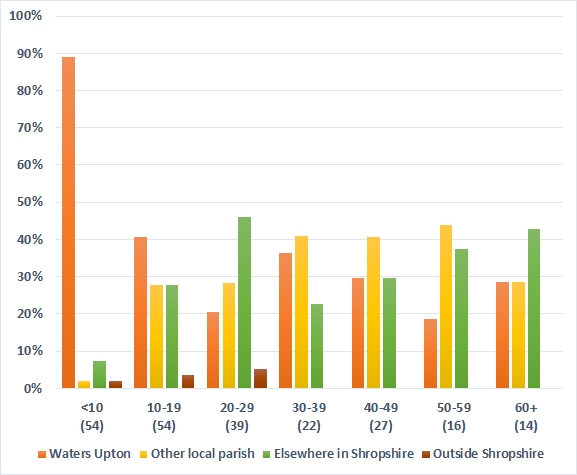
Two charts showing the geographic origins of the people enumerated on the 1841 census at Waters Upton, broken down by age group. Notes for the first chart in this section apply. The first chart shows actual numbers in each age group, the second shows percentages.
In a small parish unable to accommodate a growing population you would expect that, all things being equal, the chances of any given individual moving away will increase as they get older (not to mention the chances of them dying). A higher proportion of natives within the younger element of the population rather than within the ‘oldies’ is therefore not a surprise – but the actual extent of this within the under-10s (88.9% of whom were born in the parish) I find somewhat staggering! The dramatic drop to 40.7% for those aged from 10 to 19 is also quite striking. For older age groups although the proportion of natives fluctuates, the actual number in the 20-29, 30-39 and 40-49 groups is equal (8 for each group). Clearly, all things were not equal when it came to the chances of someone leaving the parish!
On to Part 2 ⇒
